
TL;DR:
- Australian rental vacancy data is primarily produced by private providers using differing, often opaque, methodologies.
- Vacancy rates should be interpreted in context, considering property type, trends, and methodology, not in isolation.
- Treat vacancy rates as one of many tools; over-reliance can mislead investment decisions and risk resilience.
Vacancy rates are one of the most quoted metrics in Australian property investment circles, yet they’re also one of the most misunderstood. Many investors assume a low vacancy rate automatically signals a booming rental market and a safe acquisition. The reality is far more nuanced, particularly in Australia where commercial providers rather than official statistical agencies supply most rental vacancy data. This guide will cut through the confusion, explain what rental vacancy rates actually measure, how they’re calculated across different providers, and how you can use them intelligently to strengthen your investment decisions.
Table of Contents
- What is rental vacancy rate and why it matters for investors
- How rental vacancy rates are calculated in Australia
- How to interpret vacancy rates: benchmarks and real-world meaning
- Using vacancy rate trends to inform property investment decisions
- The uncomfortable truth about relying on vacancy rates
- Take your next investment step with expert guidance
- Frequently asked questions
Key Takeaways
| Point | Details |
|---|---|
| Vacancy rate definition | Rental vacancy rate shows the percentage of properties available for rent at a given time. |
| Australian methodology variations | Different commercial providers use diverse methods to calculate vacancy rates, leading to varied outcomes. |
| Interpret with caution | Benchmarks like ‘1–3%’ are useful guides but require careful, contextual interpretation. |
| Investor application | Use vacancy rates as one tool in your strategy, combined with rental yield and other market data. |
| Professional guidance | Expert advice and premium resources can help investors make smarter decisions based on vacancy trends. |
What is rental vacancy rate and why it matters for investors
A rental vacancy rate (RVR) is simply the percentage of available rental properties in a given area that are currently unoccupied and listed for rent. If a suburb has 500 rental properties and 15 are sitting empty and advertised, the vacancy rate is 3%. That single number can shape decisions about where to buy, what rent to charge, and whether to hold or sell a property.
For property investors, the vacancy rate functions as a barometer of rental demand. A low rate suggests tenants are competing for limited stock, which typically supports stable rental income and upward pressure on rents. A high rate suggests the opposite: more supply than demand, longer vacancy periods between tenants, and potential downward pressure on rental income. This is why vacancy rate data features so prominently in market research reports and property commentary across Australia.
However, common misconceptions can lead investors astray. Many assume that:
- A vacancy rate below 3% is universally “healthy” regardless of location or property type
- All vacancy rate figures are produced using the same method and are therefore directly comparable
- A single snapshot of a vacancy rate tells you everything you need to know about a market’s rental health
- The figure reported by one data provider will match the figure from another in the same suburb
None of these assumptions are reliable. As AHURI (the Australian Housing and Urban Research Institute) notes, the private rental vacancy rate in Australia is produced by commercial organisations rather than the Australian Bureau of Statistics (ABS), and their methodologies are often opaque and can produce different outcomes. This is fundamentally different to many comparable countries where government statistical bodies supply vacancy data with standardised and transparent methodology.
Key insight: The absence of a nationally standardised, government-produced vacancy rate in Australia means that two providers can report meaningfully different figures for the same suburb at the same time. Knowing which provider you’re looking at, and how they count vacancies, is as important as the number itself.
This distinction is worth understanding if you’re exploring specialist rental models. For example, investors researching NDIS property investment opportunities or tracking outback rental price trends will encounter vacancy data that may not reflect the true dynamics of these niche segments.
Now that you know why vacancy rates matter, let’s explore how they’re measured and why that matters particularly in Australia.
How rental vacancy rates are calculated in Australia
Unlike countries where government agencies produce a single, standardised vacancy measure, Australia relies primarily on commercial property data providers such as SQM Research and PropTrack. Each provider uses its own methodology, which means the figures they produce can differ, sometimes significantly, for the same market at the same point in time.
The opaque methodologies used by commercial providers are a known limitation in the sector, and AHURI’s research highlights this as a genuine issue for accurate market assessment. The core differences between providers generally come down to three areas:
- What is counted as vacant: Some providers count only properties actively advertised online. Others may include properties listed across multiple platforms or apply adjustments for duplicate listings.
- The time threshold for vacancy: A property listed for two days and one listed for 60 days may both appear as “vacant” in one methodology but be treated differently in another.
- The denominator used: Calculating a rate requires knowing the total rental stock in an area. Providers estimate total rental stock differently, using ABS census data, their own databases, or a combination of sources.
| Provider approach | What is counted | Stock estimation method | Typical output |
|---|---|---|---|
| Listings-based | Active online listings only | Proprietary database estimates | Can undercount or overcount |
| Rolling average | Listings over 21 to 30 days | ABS census adjusted | Smoother but lagged |
| Hybrid model | Listings plus agent surveys | Combined data sources | Potentially more accurate but complex |
These variations mean a suburb might register a 1.8% vacancy rate with one provider and 2.9% with another. Neither is necessarily wrong; they’re measuring slightly different things. The consequences for your decision-making, however, can be significant if you treat one figure as absolute truth.

When reviewing vacancy data for your rental appraisal strategy or assessing opportunities to maximise rental cash flow, always verify which provider produced the data and review what their methodology documentation says. It’s also worth consulting essential rental property tips that factor in data quality alongside raw numbers.
Pro Tip: Before acting on any vacancy rate figure, go to the provider’s website and read how they define and calculate their measure. If they don’t publish a methodology document, treat the data with extra caution.
Understanding the calculation methods leads us naturally to interpretation: what do different vacancy rates tell you about market health?
How to interpret vacancy rates: benchmarks and real-world meaning
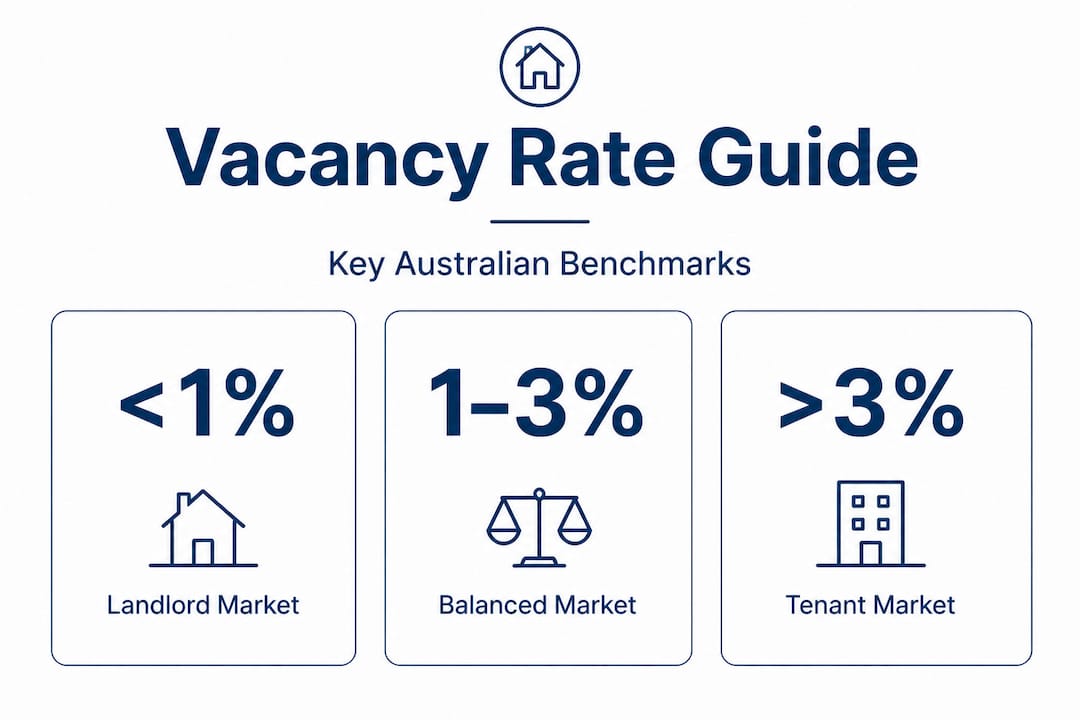
The most frequently cited benchmark in Australian property commentary is that a vacancy rate between 1% and 3% represents a balanced market. Below 1% is considered extremely tight, favouring landlords with strong rental income and pricing power. Above 3% is generally seen as favouring tenants, with more negotiating room on rent and potentially longer gaps between leases.
However, AHURI’s research is clear that benchmark vacancy levels can vary depending on methodology and region, and that RVRs should never be viewed in isolation when assessing market health. Treating the 1 to 3% range as a universal truth can lead investors to draw the wrong conclusions.
Here’s a practical framework for interpreting vacancy rates with proper context:
- Compare like with like. Only compare vacancy rates produced by the same provider over time, or between suburbs using identical methodology. Cross-provider comparisons are unreliable.
- Consider the property type. A 2% vacancy rate in a suburb dominated by inner-city studios tells a very different story to a 2% rate in a family-oriented suburb with mostly three-bedroom houses.
- Look at the trend, not just the snapshot. A rate moving from 4% down to 2.5% over six months signals improving demand. A rate moving from 1.5% up to 2.8% signals softening conditions, even if it’s still within the “balanced” range.
- Account for seasonality. Vacancy rates typically rise in January and February as students and young renters shift locations. A spike during these months may not indicate a structural problem.
- Cross-reference with days on market and rental price movements. If vacancy is low but median rents are flat or falling, something else is affecting demand that the vacancy rate alone isn’t capturing.
| Vacancy rate | General interpretation | Caution |
|---|---|---|
| Below 1% | Extreme rental demand, landlord’s market | May be distorted by low total stock in small areas |
| 1% to 2% | Strong demand, limited supply | Confirm with rental price growth data |
| 2% to 3% | Balanced conditions | Benchmark accuracy depends on methodology |
| 3% to 5% | Tenant’s market, softer demand | Check for seasonal or structural causes |
| Above 5% | High supply or weak demand | Review population and employment trends |
Statistic callout: In markets with fewer than 300 total rental properties, a vacancy rate can shift by a full percentage point with just three or four properties becoming vacant simultaneously. This volatility makes raw percentages particularly misleading in regional and rural markets.
Investors building their portfolio across varied markets will find that a rental guarantee strategy can provide a useful buffer when vacancy rate data is ambiguous. Similarly, if you’re exploring opportunities in the disability housing space, understanding NDIS property investment trends requires looking beyond standard vacancy metrics entirely.
Once you understand interpretation and context, let’s look at practical ways vacancy rates can inform your investment strategy.
Using vacancy rate trends to inform property investment decisions
Vacancy rate data, used correctly, is a genuinely useful instrument in your investment toolkit. The key word is “used correctly.” Investors who treat it as the primary signal for acquisition or disposal decisions often find themselves working with incomplete information.
Here’s how vacancy rate trends can meaningfully support smarter decisions:
- Identifying emerging markets: A suburb showing a consistent downward trend in vacancy over 12 to 18 months, accompanied by population growth and new infrastructure announcements, may represent a well-timed acquisition opportunity before the broader market prices in demand.
- Rental pricing decisions: When vacancy in your suburb drops below 1.5%, it’s a signal to review your current rent against comparable listings. Keeping rent below market rate in a tight market directly costs you yield without improving tenant retention meaningfully.
- Timing between tenants: A tightening vacancy rate means your property is likely to lease faster when vacant, reducing the downtime cost between tenancies. A loosening rate means you should prepare for longer vacancy periods and potentially price more competitively from the start.
- Risk assessment at acquisition: Comparing vacancy trends across two or three candidate suburbs can help you weight the relative risk of each. Consistent low vacancy with stable rents over multiple years is a more compelling signal than a single data point showing a low current rate.
- Portfolio review: Rising vacancy across multiple properties in the same region can be an early warning that a market is shifting. Acting proactively on a portfolio review is far more effective than waiting until vacancy costs accumulate.
As AHURI consistently emphasises, RVRs should not be viewed in isolation when assessing market health. Combine your vacancy rate analysis with rental yield data, population movement statistics, employment rates in the area, and the quality of your property management. All of these factors interact to determine your actual investment outcome.
Pro Tip: Set a quarterly calendar reminder to review vacancy trends across each suburb where you hold property. Tracking a 12-month moving trend line gives far more strategic insight than any individual monthly figure. Pair this review with guidance from proven rental property management tips to keep retention high regardless of market conditions.
With actionable strategies in hand, here’s a fresh perspective that most investors miss when they obsess over vacancy numbers.
The uncomfortable truth about relying on vacancy rates
Here’s something most market commentary won’t tell you directly: obsessing over vacancy rates can actually work against you as an investor. The figure is seductive because it feels precise, a single percentage that appears to summarise an entire market. But that precision is largely illusory given what we know about how inconsistently the data is produced in Australia.
We’ve seen investors pass on excellent acquisition opportunities in markets carrying a 3.5% vacancy rate, only to watch those properties achieve outstanding long-term returns because the vacancy rate reflected a temporary oversupply being absorbed by genuine underlying demand. We’ve also seen investors chase markets with sub-1% vacancy only to find that the tight conditions reflected a tiny rental pool in a declining regional town, not genuine investment-grade demand.
The investors who build genuinely resilient portfolios treat vacancy rates as one input among many, not as a verdict. They look at who is renting in an area, why they’re renting there, what the employment base looks like, and whether the property itself is positioned to attract quality, long-term tenants. These are questions that a vacancy rate percentage simply cannot answer.
There’s also a quality of management dimension that vacancy rate data entirely ignores. A well-managed property in a 3% vacancy market can maintain consistent occupancy if it’s well-presented, competitively priced, and actively marketed. A poorly managed property in a 1% vacancy market can still sit empty for weeks due to neglect or mismanagement.
The roadmap to consistent returns isn’t found in any single metric. It’s built from rigorous due diligence, sound asset selection, and ongoing active management. Use vacancy rate data to orient yourself, but rely on a full suite of rental property insights to navigate with confidence. The vacancy rate tells you where the market has been. Your strategy determines where your portfolio goes next.
Take your next investment step with expert guidance
Understanding rental vacancy rates is a crucial step, but translating that knowledge into profitable action is where the real work begins. At Elite Wealth Creators, we help Australian property investors move from information to strategy with precision. Whether you’re reviewing your current portfolio through our property investing insights resources or exploring the advantages of SMSF property investment, our team provides the specialist guidance to help you act with confidence. We offer precision sourcing, cash flow modelling, and off-market access to opportunities aligned with your long-term wealth strategy. Reach out today and let’s build a portfolio that performs across all market conditions.
Frequently asked questions
How is rental vacancy rate different in Australia compared to other countries?
Australian vacancy rates are measured mainly by commercial providers, whereas in many comparable countries statistical agencies supply the data with standardised methodology. As AHURI notes, Australia’s reliance on commercial organisations makes the data less consistent and harder to compare nationally.
What does a ‘normal’ vacancy rate look like for Australian property markets?
Benchmarks like 1 to 3% are commonly cited, but their meaning varies significantly depending on region, property type, and the methodology used to calculate them. AHURI cautions that benchmark vacancy levels can vary depending on methodology and region, so context is essential before drawing conclusions.
Can the vacancy rate alone predict if my investment will be successful?
No. Vacancy rate is a useful indicator but should always be considered alongside other market measures such as rental yield, population trends, and property management quality. AHURI argues that RVRs should not be viewed in isolation when assessing market health.
Where can I find reliable rental vacancy rate data for Australia?
Most data comes from commercial organisations such as SQM Research and PropTrack, so it’s best to check multiple sources and carefully review each provider’s stated methodology. AHURI notes that these commercial producers use different, often opaque, methodologies that can produce varying results.
Recommended
- Rental property management tips to maximise returns | Elite Wealth Creators
- 6 Must-Know Rental Tips for Aussie Investors | Elite Wealth Creators
- Maximise rental income with effective appraisals | Elite Wealth Creators
- Maximise Your Australian Rental Cash Flow | Elite Wealth Creators
- Rental Yield Explained: Boost Your Singapore Property Returns